

Did you know that 43% of websites currently fail to meet the “good” threshold for Interaction to Next Paint (INP)? In 2026, a single second of lag isn’t just an annoyance; it’s a confirmed ranking signal that can slash your conversions by 7%. If you are staring at a dashboard full of acronyms like LCP and CLS while wondering why your results change every time you hit refresh, you aren’t alone. Learning how to test your website speed effectively is the first step toward reclaiming your search engine rankings and keeping your visitors happy.
It’s frustrating to see conflicting data from different tools when your site’s visibility is on the line. We understand that technical terms like TTFB and field data can feel like a different language. This guide will show you exactly how to measure your performance, interpret those complex metrics, and use the industry’s most reliable tools to get consistent results. We’ll walk through a repeatable testing process and provide actionable steps to fix the most common speed bottlenecks holding you back.
Key Takeaways
- Discover the three industry-standard tools that provide the most reliable performance data to help you move beyond inconsistent results.
- Master the professional workflow for how to test your website speed, including essential prep steps like clearing your cache and selecting the right server locations.
- Learn why chasing a perfect 100/100 score is often unnecessary and how to prioritize the specific “Opportunities” that actually impact your Google rankings.
- Identify actionable “quick wins” such as image compression and CDN implementation to immediately reduce bounce rates and improve user experience.
Understanding Website Speed and Why It Matters in 2026
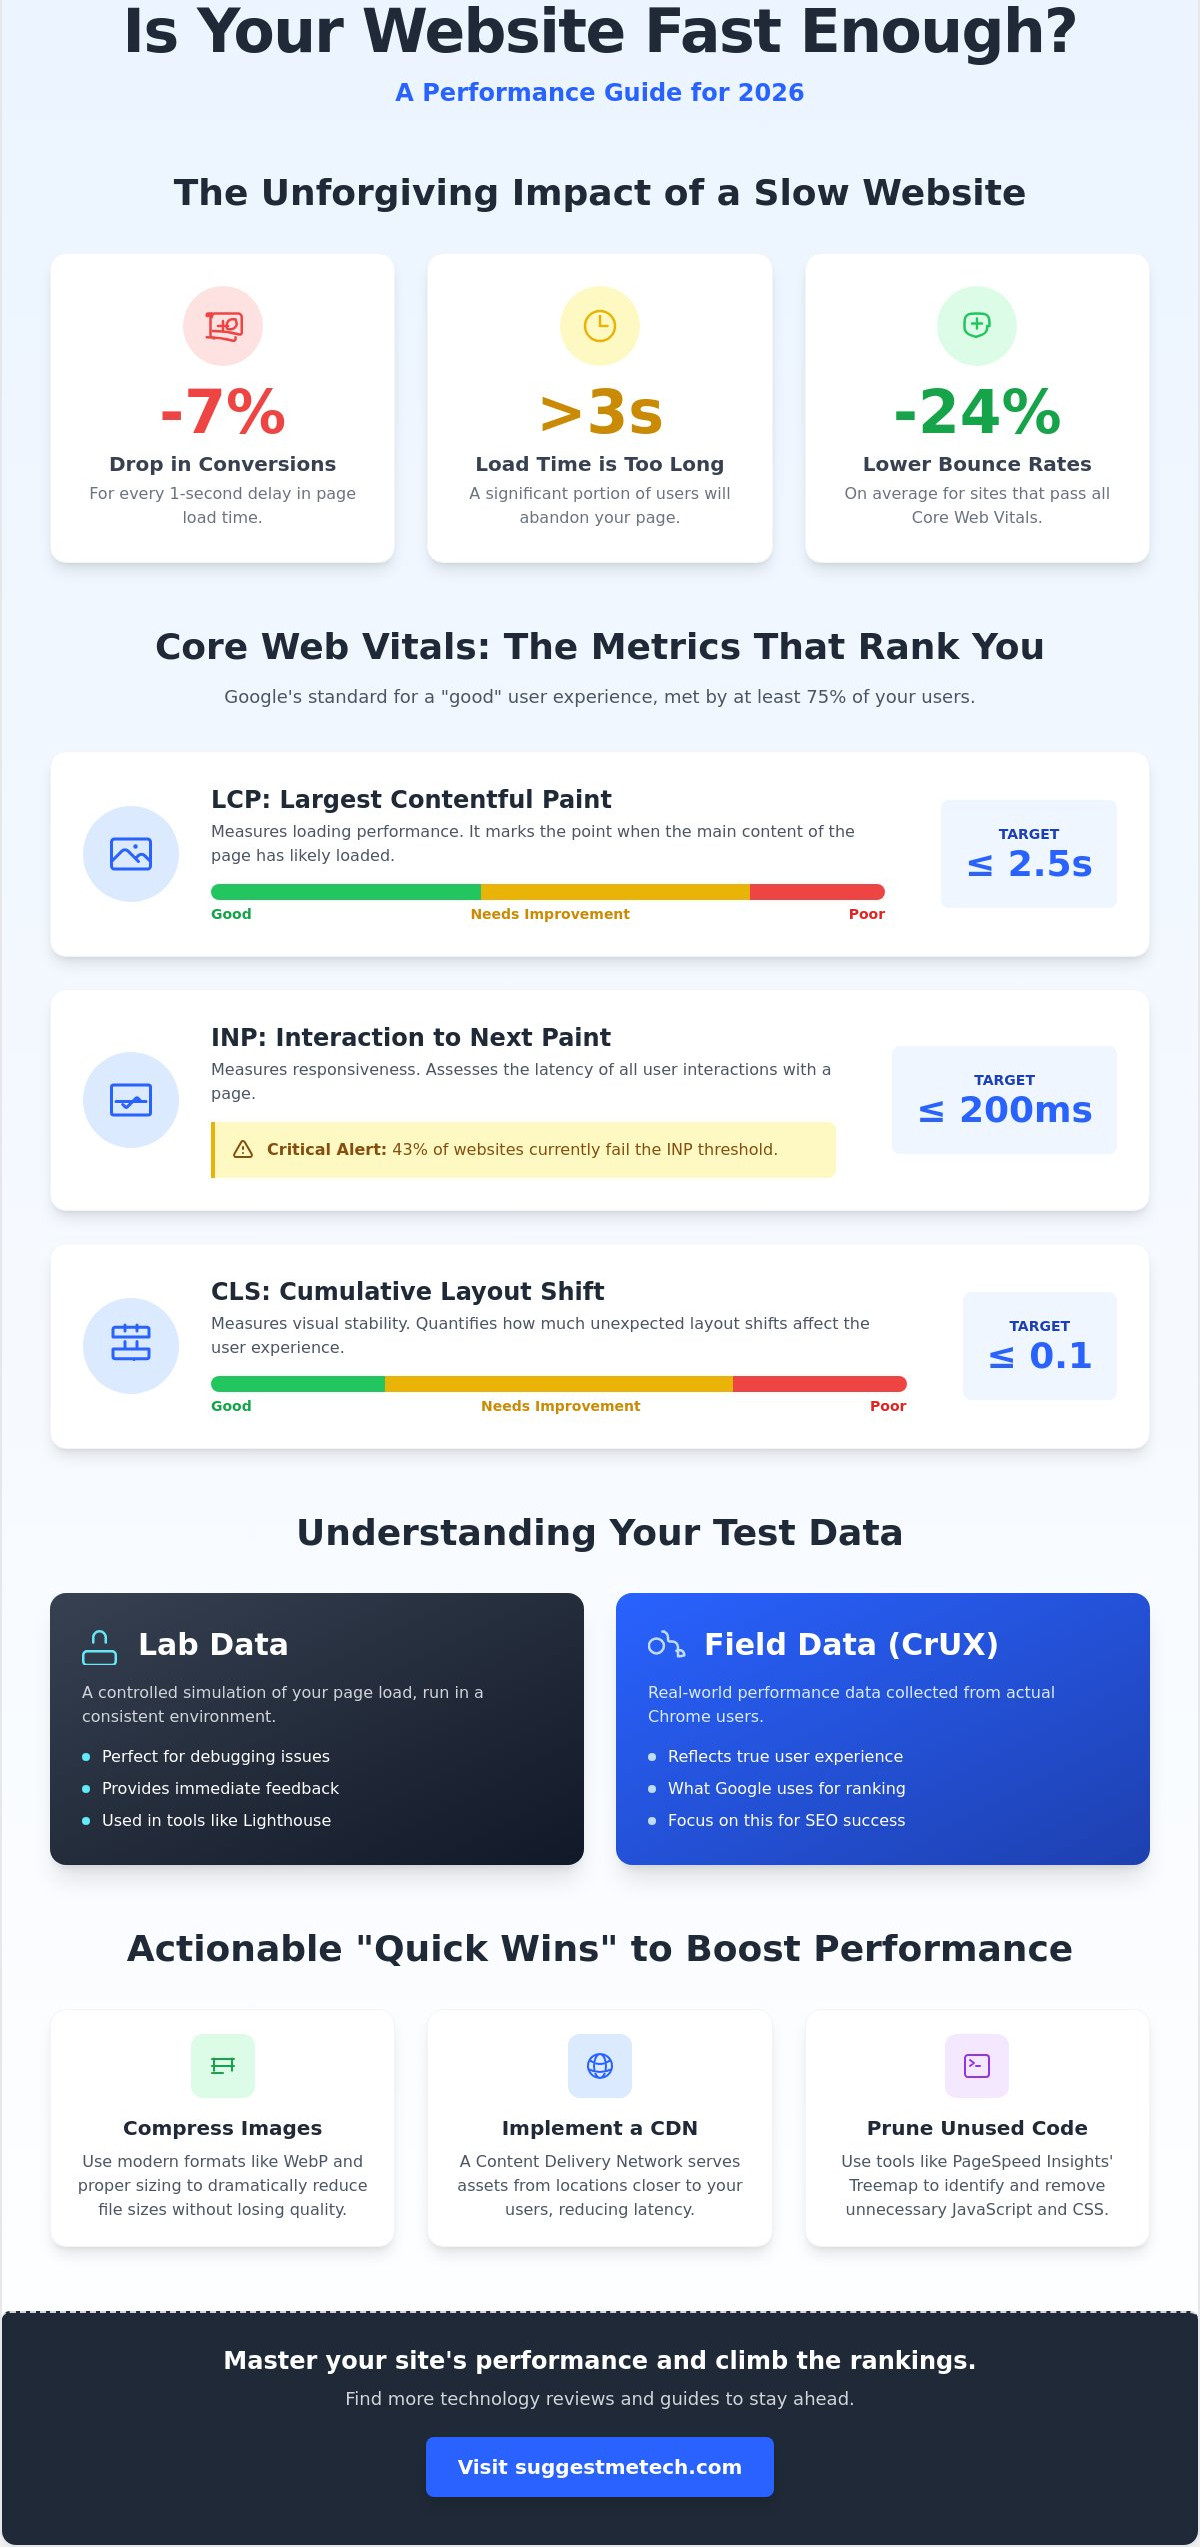
Website speed isn’t just about how fast a page appears on a screen. It is the measure of how quickly a page becomes fully interactive for a visitor. In technical circles, Web performance refers to the speed at which web content is downloaded and displayed in a browser. By 2026, the “3-second rule” has become a strict reality for online success. If your site takes longer than three seconds to load, a significant portion of your audience will abandon the page before they even see your content. Knowing how to test your website speed is the only way to ensure you aren’t losing customers to a faster competitor.
The business impact of a slow site is direct and unforgiving. Research shows that a one-second delay in page load time can reduce conversions by 7%. For a high-traffic blog or a digital storefront, that tiny lag translates to thousands of dollars in lost revenue. On the flip side, performance gains lead to measurable growth. For instance, Vodafone Italy saw an 8% increase in sales simply by improving their Largest Contentful Paint (LCP) by 31%. Sites that pass all performance thresholds see 24% lower bounce rates on average, proving that users stay longer when the experience is seamless.
The Impact on SEO and Search Rankings
Google’s algorithm treats speed as a foundational ranking signal. Slow sites face a double penalty: lower search positions and a reduced crawl budget. When your server is sluggish, Google’s bots spend more time waiting for responses and less time indexing your new content. Since Google uses mobile-first indexing, your mobile performance is the primary baseline for your rankings. If you don’t prioritize mobile speed, your search visibility will suffer regardless of how fast your site feels on a desktop. Learning how to test your website speed on mobile devices is no longer optional; it is a requirement for survival in search results.
Core Web Vitals: The Metrics That Actually Count
To succeed in 2026, you must monitor three specific metrics that Google uses to evaluate user experience. For a page to be considered “good,” at least 75% of your real-world users must meet these thresholds:
- Largest Contentful Paint (LCP): This measures perceived load speed by tracking how long it takes for the largest visual element to appear. Aim for 2.5 seconds or less.
- Interaction to Next Paint (INP): This is the 2026 standard for responsiveness. It measures the delay for every interaction on a page. Currently, 43% of websites fail this test. A good score is 200 milliseconds or less.
- Cumulative Layout Shift (CLS): This tracks visual stability. If buttons or text jump around while the page loads, your score will drop. You need a score of 0.1 or less to prevent user frustration.
Comparing the Best Free Tools for Accurate Performance Data
Choosing the right diagnostic equipment is crucial for a successful performance audit. You can’t rely on a single score to tell the whole story because different tools measure different aspects of the user journey. Professionals use a combination of platforms to verify results and uncover hidden bottlenecks. When you are learning how to test your website speed, you’ll encounter two distinct types of data: Lab and Field. Lab data is a controlled simulation, perfect for immediate debugging. Field data, pulled from the Chrome User Experience Report (CrUX), reflects what real visitors actually experience. Since Google uses field data to evaluate Core Web Vitals for ranking purposes, it’s the metric that carries the most weight for your SEO.
Selecting the best tool for your needs depends on three main criteria: ease of use, depth of data, and cost. While most entry-level tools are free, the value lies in how they present complex information. You need a tool that doesn’t just give you a number but provides a roadmap for improvement. If you want to stay updated on the latest digital trends and optimization strategies, you can find more technology reviews and guides to help you navigate the ever-changing landscape of web performance.
Google PageSpeed Insights & Lighthouse
Google PageSpeed Insights (PSI) is the industry standard because it provides a direct look at how Google views your site. It combines Lighthouse lab data with real-world field data. One of its most powerful features is the ‘Treemap’ view. This visualization allows you to see exactly which JavaScript files are bloating your page size, making it easier to prune unnecessary code. Keep in mind that your mobile and desktop scores will likely differ. PSI tests mobile performance using a simulated mid-tier device on a 4G connection, which is often a much tougher test than the desktop version.
GTmetrix and Pingdom: Detailed Performance Reports
While Google tells you what is wrong, GTmetrix shows you the visual impact. Its filmstrip view provides a frame-by-frame look at how your site renders for a user. This helps you identify if a large hero image is loading too late or if a font swap is causing a jarring layout shift. Pingdom is best known for its waterfall chart. This chart lists every single request your site makes, from CSS files to third-party tracking scripts. By sorting these by load time, you can find the specific file that is slowing you down. Both tools allow you to test from various global locations, which is essential for checking latency if your audience is spread across different continents.
How to Run a Website Speed Test Like a Pro
Running a performance audit requires more than just pasting a URL into a search box. If you want accurate data that reflects the real world, you must eliminate variables that skew results. One critical first step is to clear your cache on iPhone or your desktop browser. If you don’t, you might be viewing a locally stored version of your site. This makes the page appear to load instantly for you, while a new visitor might be waiting several seconds for the same content to appear. Learning how to test your website speed like a professional means understanding that your data is only as good as the parameters you set before you hit the “Start” button.
Consistency is the secret to reliable performance testing. Server speeds and network traffic fluctuate throughout the day, so a single test rarely tells the full story. You should run at least three separate tests for every page you analyze and take the average of those results. This accounts for temporary server spikes or local network congestion. You also need to choose the right environment for your test. While desktop broadband speeds are impressive, Google’s mobile-first indexing means you should prioritize 4G or 5G simulations. Most users will access your site via a mobile device, and your testing strategy must reflect that reality.
Setting Up Your Test Parameters
Distance creates latency. If you test your site from a server in Seattle but your target customers are in London, your results will show a significant delay that doesn’t actually exist for your local audience. Always select a test server location that is closest to where your visitors live. Don’t limit your testing to just the homepage. High-traffic landing pages or complex product pages often have more scripts and larger images, making them more likely to suffer from performance issues. If you run a membership site, test it in a “logged-out” state to see what new visitors experience, as the admin bar and backend plugins can slow down the experience for logged-in users.
Executing the Test and Avoiding Common Errors
Browser extensions are silent performance killers. If you are running a local Lighthouse test, disable your extensions or use Incognito Mode. Extensions like ad blockers or SEO overlays add their own processing time to every page load, which can artificially inflate your scores. When reviewing your results, check the response headers to see if your Content Delivery Network (CDN) is actually working. Look for a “HIT” status in the cache headers. If you see a “MISS,” it means the CDN didn’t serve the file, and you aren’t seeing the true speed benefits of your global network setup.
How to Read and Interpret Your Speed Test Results
Opening your first performance report can feel overwhelming. You might see dozens of red warnings and a score that is much lower than you expected. Don’t panic. A perfect 100/100 score is rarely necessary for success. Many high-ranking, high-conversion websites operate effectively with scores in the 85 to 90 range. The goal of learning how to test your website speed is to create a seamless experience for your visitors, not just to chase a vanity metric. Focus your energy on the “Opportunities” section in Google PageSpeed Insights. This area specifically lists the fixes that will provide the most significant time savings for your users.
One of the most critical metrics to monitor is Total Blocking Time (TBT). While other metrics measure how fast things appear, TBT measures how long your page stays “frozen” before a user can actually interact with it. If a visitor tries to click a menu or scroll and nothing happens, they’ll likely leave. Often, you’ll find that unoptimized images are the primary bottleneck. If your report suggests you “Serve images in next-gen formats,” it means you are using outdated formats like PNG or JPEG when WebP or Avif could reduce your file sizes by 30% or more without losing quality.
Deciphering the Waterfall Chart
The waterfall chart is a chronological map of every request your site makes. Each horizontal bar represents a single file, such as a script, image, or stylesheet. The length of the bar shows how long that file took to load. You want to look for “Render-Blocking Resources” at the very top of the list. These are files that stop the browser from displaying any content until they are fully downloaded. If you see “Long Tasks” highlighted in your chart, these are scripts taking longer than 50 milliseconds to process, which is the main cause of user frustration and input lag.
Identifying the Biggest Speed Killers
Three common issues usually account for the majority of load time delays. First, excessive third-party scripts from ads, social widgets, and tracking pixels can easily hijack your site’s performance. Second, a high Time to First Byte (TTFB) suggests your server is struggling to respond to requests. If your TTFB is consistently over 600ms, it’s a sign your hosting environment needs an upgrade. Finally, failing to use modern compression for images remains a top reason for sluggish pages. For more help choosing the right performance-enhancing tools, check out our technology reviews and guides.
Beyond Testing: How to Boost Your Site Performance
You’ve learned how to test your website speed and identify the bottlenecks. Now, you need to implement the solutions that turn those insights into a faster user experience. Implementing a Content Delivery Network (CDN) is one of the most effective ways to reduce global latency. A CDN stores copies of your site’s static assets on a network of servers spread across the globe. When a visitor accesses your site, the CDN serves the data from the location closest to them. This significantly cuts down the physical distance data has to travel, which is vital for maintaining speed for an international audience.
Image compression and lazy loading are the ultimate “quick wins” for any site owner. High-resolution images are often the largest files on a page, so shrinking them without losing quality is essential. Lazy loading takes this a step further by delaying the download of images until they are about to enter the user’s viewport. This ensures the browser prioritizes the content the user sees first. For anyone starting a blog, minimizing CSS and JavaScript files is equally important. Leaner code requires less processing power, allowing your pages to become interactive much sooner. Caching plugins also play a major role by serving static versions of your pages, which drastically reduces the load on your server.
Technical Optimization Strategies
Advanced strategies like using “Preload” and “Prefetch” tags help the browser prioritize critical assets. Preloading tells the browser to fetch your main font or hero image immediately. Prefetching prepares assets for the next page the user is likely to visit. You should also perform regular database maintenance. Deleting old post revisions and expired transients keeps your backend responsive. Finally, keep your CMS and plugins updated. Developers frequently release performance patches that can shave milliseconds off your load times and improve overall stability.
Why Your Hosting is the Ultimate Speed Factor
Even a perfectly optimized site will struggle on poor hosting. Your host is the foundation of your site’s speed, and it sets the ultimate performance ceiling. Shared hosting is often the slowest option because you are competing for resources with hundreds of other websites on the same server. Moving to a Virtual Private Server (VPS) or managed hosting provides dedicated resources and server-side optimizations that shared plans lack. If you aren’t sure where to move your site, you can check our reviews of the best web hosting services to find a provider that prioritizes performance and reliability.
Take Control of Your Site’s Performance Today
Mastering web performance is a continuous cycle rather than a one-time task. You now have the professional framework for how to test your website speed using a mix of lab and field data to get the most accurate picture. By focusing on critical metrics like INP and LCP, you can ensure your site remains competitive in Google’s 2026 rankings. Remember that technical fixes like image compression and CDNs only work effectively when built on a solid foundation. If your server response times are still lagging after optimization, it’s likely time to evaluate your infrastructure.
Check out our top-rated web hosting providers to boost your site speed instantly. Our expertly reviewed hosting comparisons and real-world performance benchmarks provide the community-driven tech advice you need to make an informed choice. Fast loading times are within your reach. Start implementing these steps today and watch your engagement grow.
Frequently Asked Questions
Why does my website speed test result change every time I run it?
Variations in server load and network congestion cause these fluctuations. Every time you perform a test, the server might be handling a different number of simultaneous requests. Local network traffic and background processes on the testing server also play a role. To get a reliable baseline, you should always run multiple tests and take the average score rather than relying on a single result.
What is a good score on Google PageSpeed Insights?
A score of 90 or above is considered “Good,” while 50 to 89 indicates a need for improvement. However, chasing a perfect 100 is often unnecessary for most business goals. You should prioritize passing the Core Web Vitals thresholds, such as an LCP under 2.5 seconds and an INP under 200ms. These real-world metrics are more important for your actual user experience and Google rankings than the aggregate lab score.
Does website speed really affect my Google ranking in 2026?
Yes, website speed is a confirmed ranking signal through Google’s Core Web Vitals. Since March 2024, Interaction to Next Paint (INP) has replaced FID as a key responsiveness metric. Google uses field data from real users to determine if your site provides a high-quality experience. If your site consistently fails these performance thresholds, your visibility in search results will likely decrease compared to faster competitors.
How often should I test my website speed?
You should test your performance at least once a month or whenever you make significant changes to your site. Large updates, such as installing a new plugin, changing your theme, or adding high-resolution images, can unexpectedly slow down your pages. Regular monitoring helps you catch these bottlenecks early. Understanding how to test your website speed consistently allows you to maintain a fast experience as your content grows.
Can too many plugins slow down my website?
Yes, excessive plugins can significantly increase your page load times and server response delays. Each plugin adds its own set of scripts, stylesheets, and database queries that the browser must process. It’s not just the number of plugins that matters, but the quality of their code. You should regularly audit your active plugins and delete any that aren’t essential to your site’s core functionality.
What is the difference between mobile and desktop speed scores?
Mobile scores are usually lower because they are tested using a simulated mid-tier device on a 4G connection. Desktop tests assume a high-speed broadband connection and more powerful hardware. Since Google uses mobile-first indexing, your mobile performance is the primary factor for your rankings. Learning how to test your website speed on mobile specifically is crucial for reaching the majority of modern web users.
Is a free speed test tool as accurate as a paid one?
Free tools like Google PageSpeed Insights and GTmetrix are highly accurate and sufficient for most website owners. They provide the same underlying Lighthouse data used by many professional agencies. Paid tools often offer additional features like automated daily monitoring, more test locations, and white-label reports. For basic performance optimization and debugging, the free versions of industry-standard tools provide all the data you need to succeed.
How do I fix a ‘High Time to First Byte’ (TTFB) error?
Fixing a high TTFB usually requires improving your server’s configuration or upgrading your hosting plan. You can often reduce this delay by implementing server-side caching and using a Content Delivery Network (CDN) to serve data closer to your visitors. If your TTFB remains high after these optimizations, your web host might be oversubscribed. Moving to a managed host or a VPS can provide the dedicated resources needed for faster responses.